





Are you having more or less sex than your peers? Has ket finally taken over as the scarfie drug of choice? How visible is our OUSA president? Critic Te Ārohi has the answers. Welcome to the results of the sixth annual Critic Te Ārohi Census! Census is a nosy and fairly invasive deep dive into Otago students and their habits around university, AI, drugs, drinking, sex, and social media.
Everyone saying thank you to Gryffin Blockley for working his magic on the raw data set. Note that for most questions respondents could select more than one answer, so totals adding to more than 100% are intentional, we promise.
Disclaimer: Some AI was used to explain Excel to me because I skipped my recommended statistics papers, sorry.
Demographics
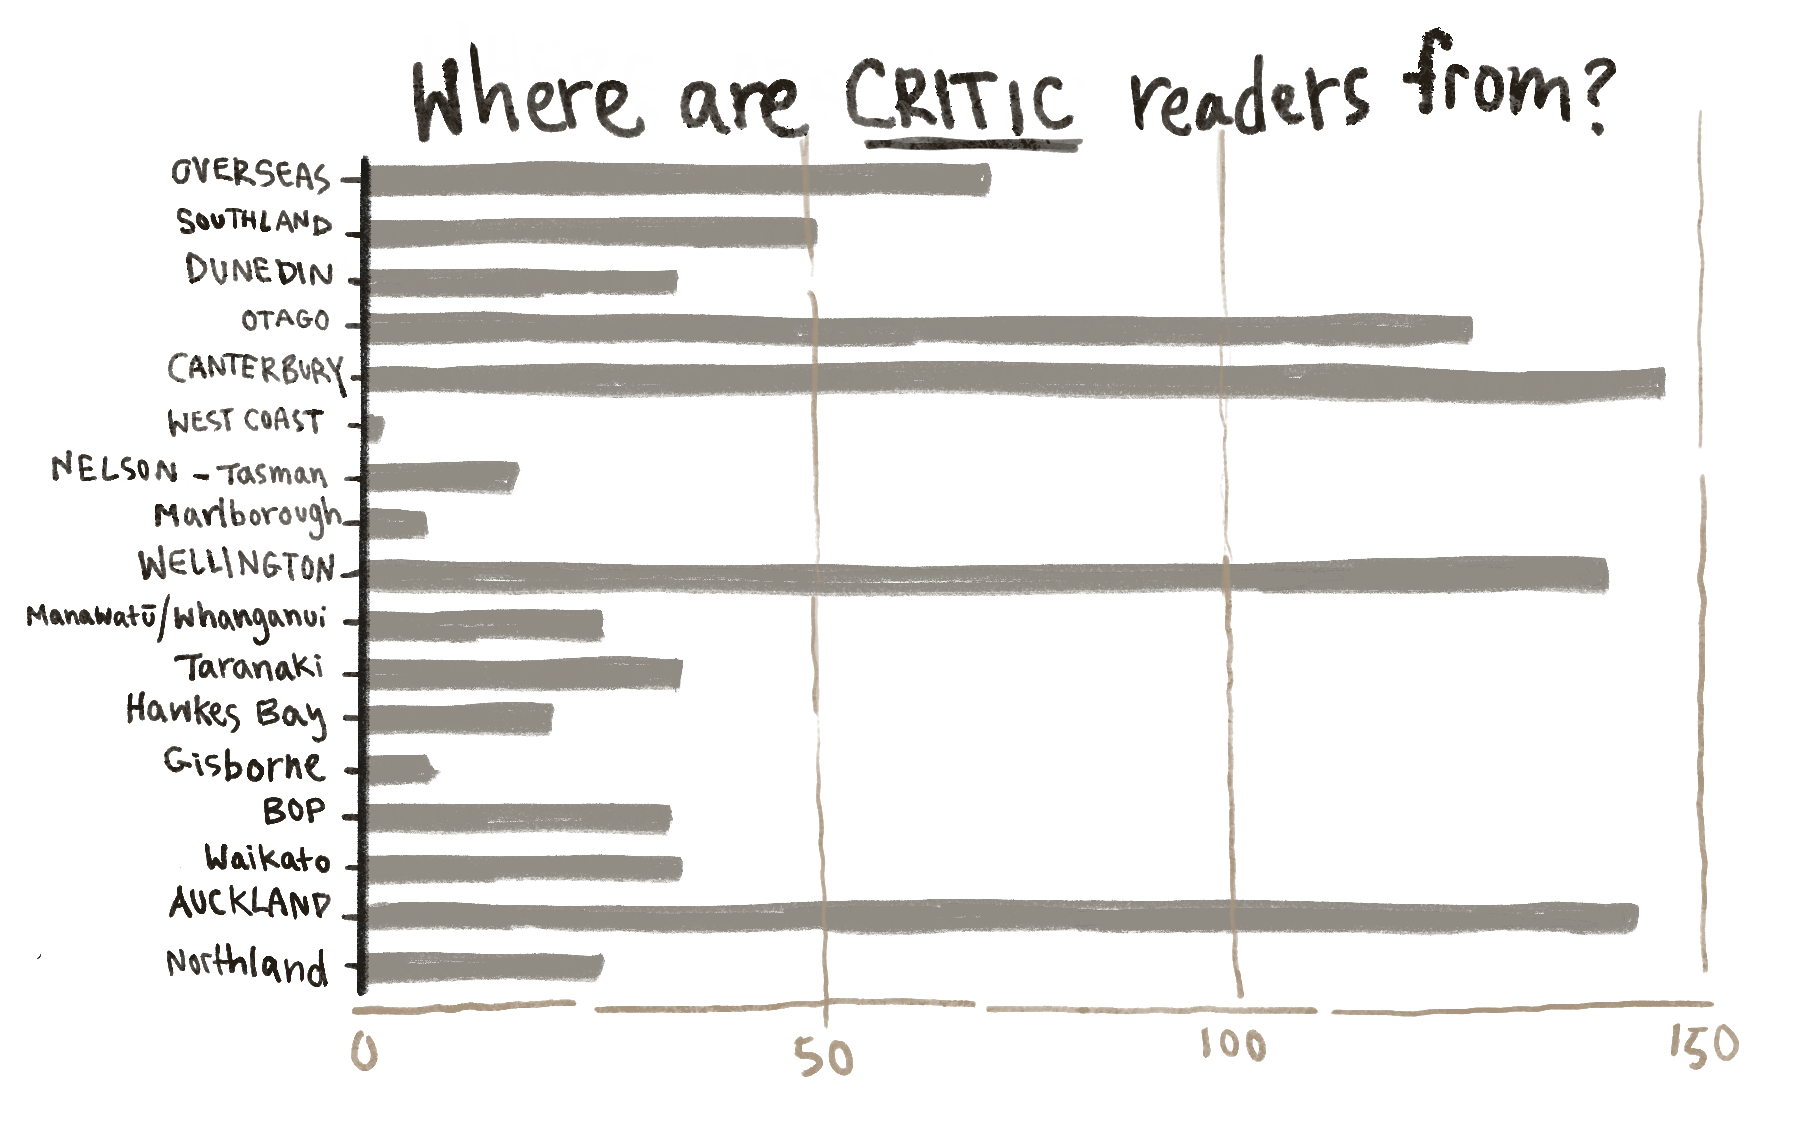
974 of you filled out the census this year, a number second only to 1005 in 2024, and more than double what we needed for a statistically significant sample. You guys are our favourites, and we love you. Deadass, thank you so much for taking the time. So let’s get to know our wonderful respondents!
According to the Uni’s quick stats on their website (great research, we know), there were 21,295 students enrolled at Otago as of 2025. So, nearly 5% of them did the census. That’s like nearly the threshold to enter Parliament. The average respondent was a straight second year Pākehā atheist female from Canterbury, who reads Critic every week.
Overall though, our basic data was fairly representative of demographics compared to the Uni’s stats. 70.8% of our respondents were female, 23.8% male, and 5.5% gender diverse. Uni stats reflect a student demographic that is 61.1% female, 38.0% male and 0.01% gender diverse. We’re loving the queens and the queers over here.
To those of you who called us out for not having Pasifika as a set option in our ethnicity section – that was a total fuck up, and we’re so sorry. 68.4% of census respondents were Pākehā, 11.5% Māori, 8.2% Asian, 1.6% Pasifika, 3.5% Middle Eastern, Latin American or African and 6.5% were Other. Uni stats reflect a demographic that is 69.8% Pākehā, 12.5% Māori, 22.2% Asian, 7.1% Pasifika, 5.1% Middle Eastern, Latin American or African, and 3.1% as Other or unknown.
Uni demographic stats are informed by the questions you answer in enrolling, which forces everyone to answer. That’s unfair. Once we transition into gaining full dictatorship power, we’ll really have the tea. However, for now, we’ll stick to our strengths:
asking students questions the University can’t.
For some extra for experts stats, 58.5% of respondents are atheists, and 23% are agnostic. 14.4% are Christian, 1.1% are Muslim, 0.8% are Buddhist, and 0.8% are Hindu. 0.4% identified as spiritual, and the remaining 1% is made up of a few other faiths.
56% of you are heterosexual, 37.8% identify as LGBTQIA+ (with 21.8% of students identifying as bisexual), and the remaining 6.2% are questioning or unlabelled. This is surprising, considering that according to StatsNZ, only 4.9% of the entire NZ population identify as LGBTQIA+. We heard StatsNZ wishes they were us.
The University
The University of Otago undoubtedly has a reputation for being that uni, with a flourishing drinking culture that revolves around a Castle Street permanently alight with burning couches. However, we all know that there’s much more to Otago than that, such as the occasional lecture or three free hours of power. Apparently students like that, considering 95.4% of you are happy with your choice to attend the University of Otago. Aw. Only 2.8% wished you had gone to a different university, and 1.8% of you wished you hadn’t gone to university at all.
 Halls
Halls
85.5% of respondents went to a hall. Of these students, the largest number went to Carrington (15.2%), followed by Caroline Freeman College (10.4%), and Te Rangihīroa (8.4%). 84% of students who did go to a hall were happy with their choice. Of those that were unhappy with their choice, the majority wished they’d gone to Selwyn instead – nothing like a bit of cult FOMO to get enrolment up.
Academics
In terms of fields of study, Science was the most studied field, with 388 of you landing in this category (this included those studying towards a Bachelors or Masters of Science, and more specialised degrees such as Bachelors of Surveying). Humanities was second with 307 respondents (this included Bachelors of Arts, as well as Teaching, but not Law), and Health Sciences took out third with 160 (this included those studying Medicine, first year Health Science, and Biomed, as well as things like Pharmacy, Physio, and Dentistry). 135 of you are doing Law and 119 are doing Commerce. For conjoint degrees such as a BASc, we included you under both science and arts. Please don’t come for us for any of this categorising, decisions had to be made. Also – the number of you that don’t know what degree you’re doing is concerning.
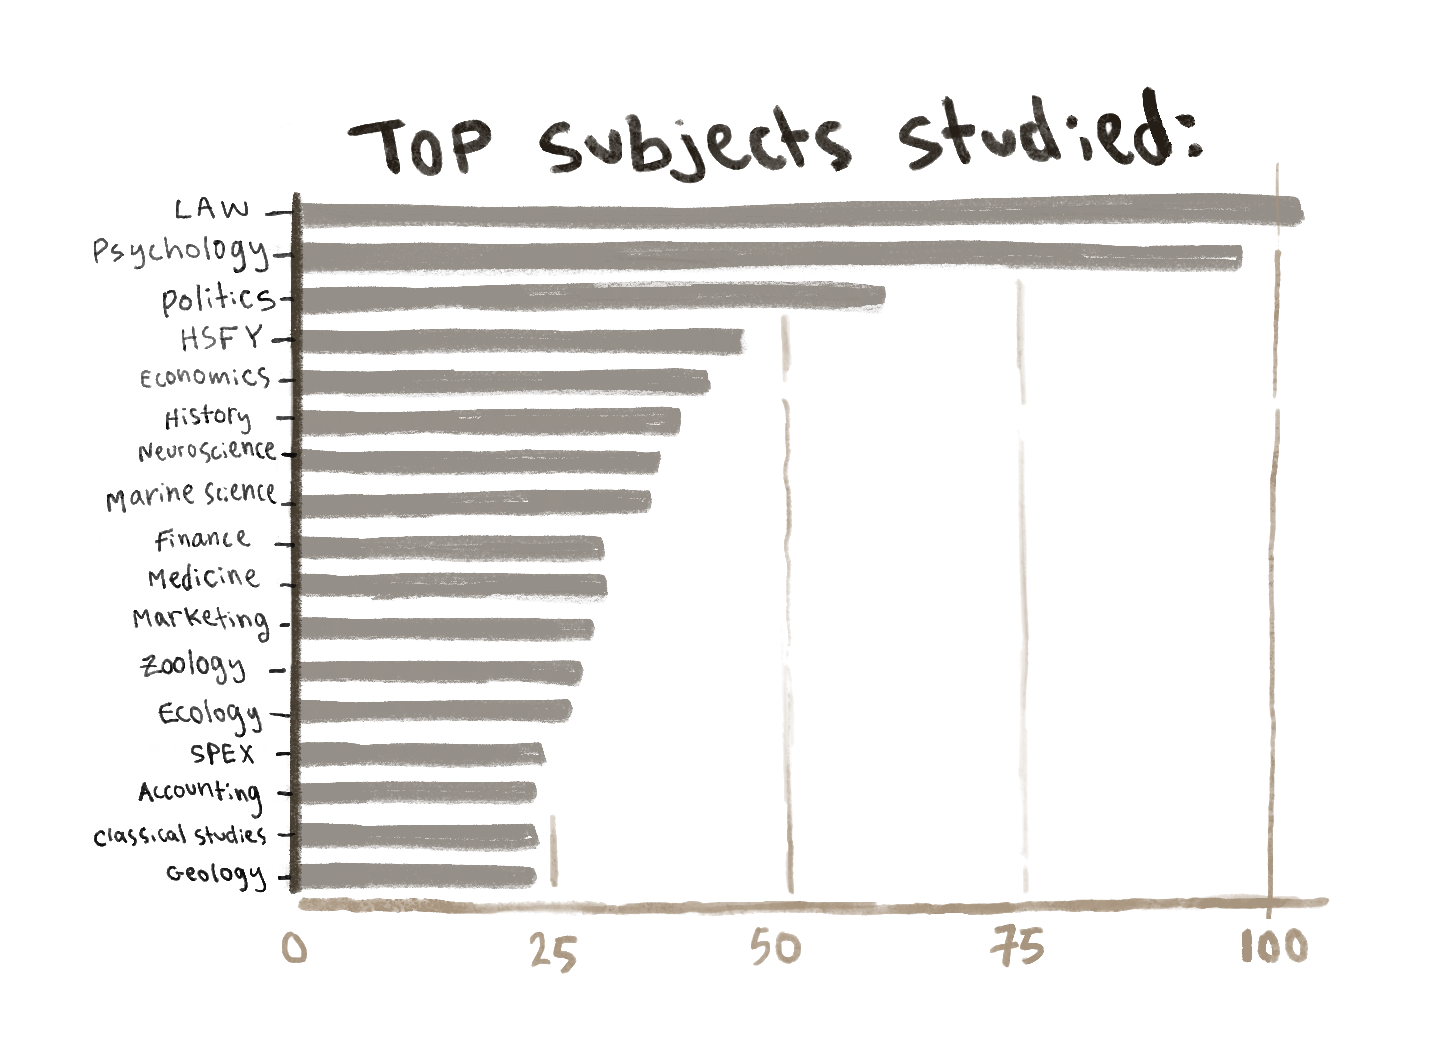
As expected, Law demolished for the degree of choice, with Psychology and Politics making impressive bids for second and third respectively. For anyone who does have a problem with how the degree data was organised, just look at this pretty picture of the top subjects studied.
Despite the slander it used to get on the Castle26 (RIP) and UoO Confessions Facebook pages, Central Library once again took the win for favourite library. 48.8% of respondents couldn’t get enough of Cench, rivalled only by the sick, twisted 18.7% of you that can be found at the Robertson.
Future Plans
56.5% of students have some idea of what they’re going to do after university. Whether that’s just a prepared script for your family or friends when they ask what you’re going to do with your life, or an actual plan, we don’t need to know. 24.8% are certain they know what they want to do (6.2% of which said they’ve known since they were just little babies). That’s a decrease from the 31.3% that were certain of their career paths in 2024. To the 18.8% that put “no, it’s a sensitive subject”, we see you.
Breaking this down by degree, Humanities had the highest comparative percentage of students with no idea (22.0%), but also the highest percentage of students that have known what they wanted to do all along (8.4%). 41.7% of Health Science students are certain of what they want to do, compared to only 18.3% of Science students. Surprisingly, Law students had the lowest number of students certain about their future plans, with just 16.3%.
Lecture Attendance
Assuming you were more honest with us about your lecture attendance than you are with your parents, 30.2% of you go to every lecture unless you have a valid reason (“valid” being a fairly loose and subjective term). 6.4% said they never attend lectures. The rest of you were split between attending most of the time, occasionally, and half of the time (in that order).
The Uni’s new lecture recording policy seems to have been beneficial to the majority of students (51.1%), who say they always catch up on the lectures they miss using recordings. 7.9% state they never catch up lectures they miss, and another 7.9% said they usually watch lectures online instead of attending.
Critic Te Ārohi
Time to talk about ourselves – our favorite thing to do. 60.2% of you lovely people read Critic every week. 34.6% pick it up occasionally. To the 5.1% who answered that they don’t read Critic, thanks for filling out the census anyways. Moaningful Confessions and Horoscopes were by far the favourite columns (38.9% and 37.9% respectively), with Booze Review making its way up in the world (8.7%).
Rice Purity
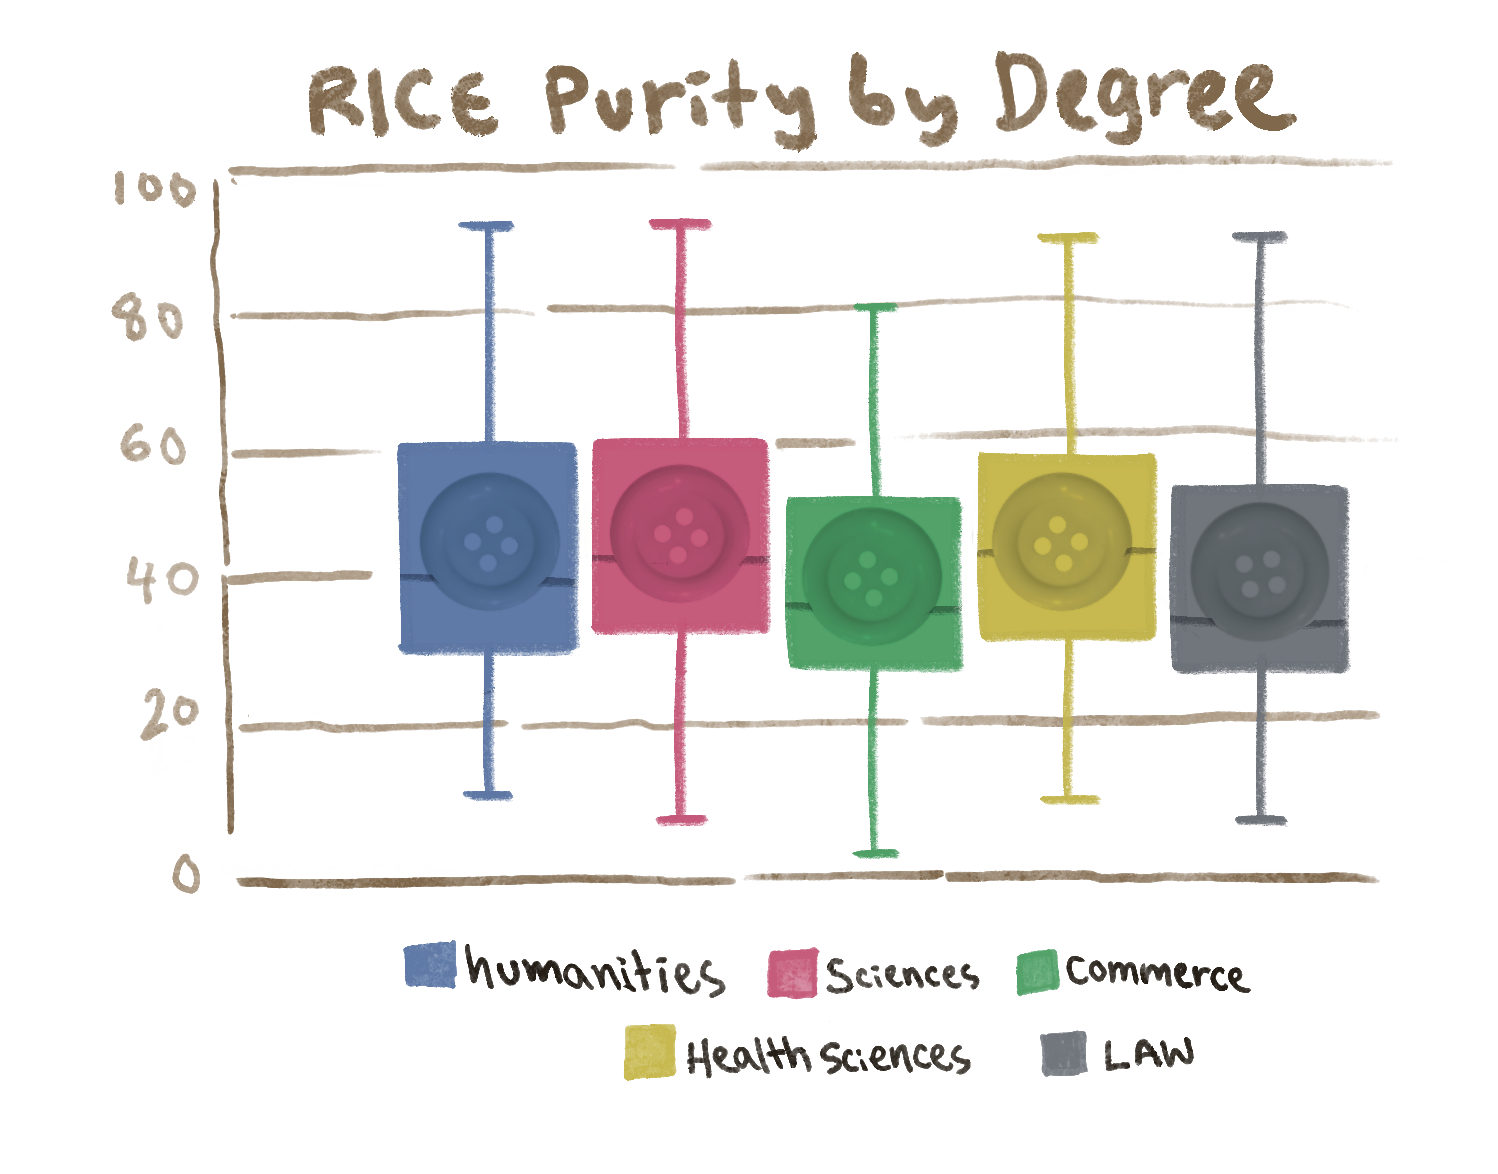
Thank you to those who took the time to redo the Rice Purity test. We’re sorry it wasn’t the Critic Vice Purity test – we’re working on making that the official version. The average score was 49.7, pretty close to 2025’s average of 50.9. The student population is only getting naughtier! Two people scored 1 (it’s a toss up between if they committed an act of incest, of bestiality, or of lying for attention), and two scored 100 (Critic hereby gives you permission to hold hands with us romantically). We’ve got every end of the spectrum here at Otago, folks. A lot of you felt the need to clarify that your scores of 67 and 69 weren’t jokes. We appreciate that.
Comparing your scores by your degree actually didn’t tell us a lot. Science and Health Sciences have the highest median averages of 48 and 47 respectively. Humanities follow with an average of 44 (an increase from last year's 39), then Law with 41, and Commerce with 40. Go figure.
 Social Media
Instagram is the most frequently used app (42.9%), followed by TikTok (35.5%), and Snapchat (only 7.8%). Special mentions to the 5 people who said OneNote, the 4 who said Hay Day, and the one who said the New World app.
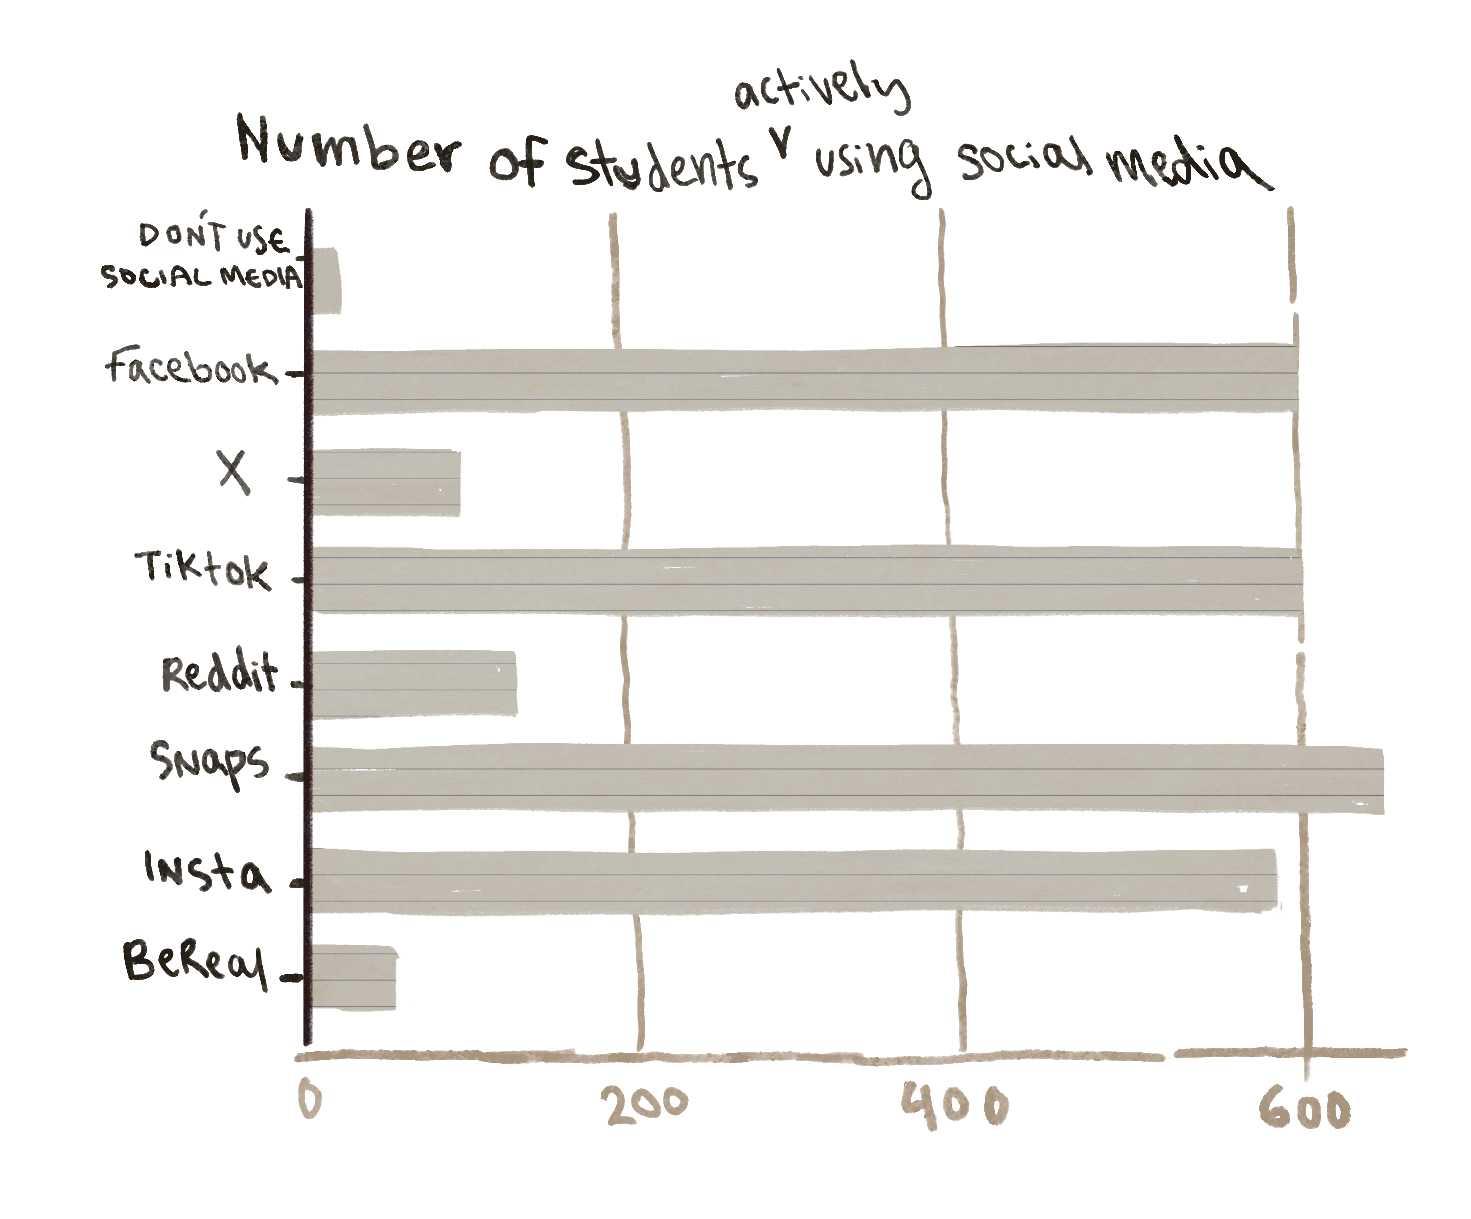
Although students spend less time on it, Snapchat beat Instagram this year as the social media platform that the most students actively use (657 of you!). Didn't you guys read the Tabloid issue? Snapchat is OUT! Find a new way to send nudes, or a dealer that doesn’t rely on posting various leaf and gear emojis on their story the week of Electric Ave.
 AI
AI
In terms of AI, there are pretty mixed feelings. While 25.6% of you (up from 23.3% in 2025, but down from 34.4% in 2024) said you never use AI. This was emphasised in the comments section, with responses ranging from “fuck AI”, to a rant about how “people who outsource their thinking to machines should be sent to inpatient psychiatric facilities until they are judged capable to return to society”. For the rest of you, the most common uses for AI include learning concepts or studying (57.8%), planning, writing, and/or editing (39.2%) assignments, as a replacement for Google or everyday use (17.2%), or as a friend or for advice (11.8%). To the ten of you that said you only use it for coding, that’s valid. To the person who said Claude AI sends them nudes, we’re almost sure you’re kidding.
Dating
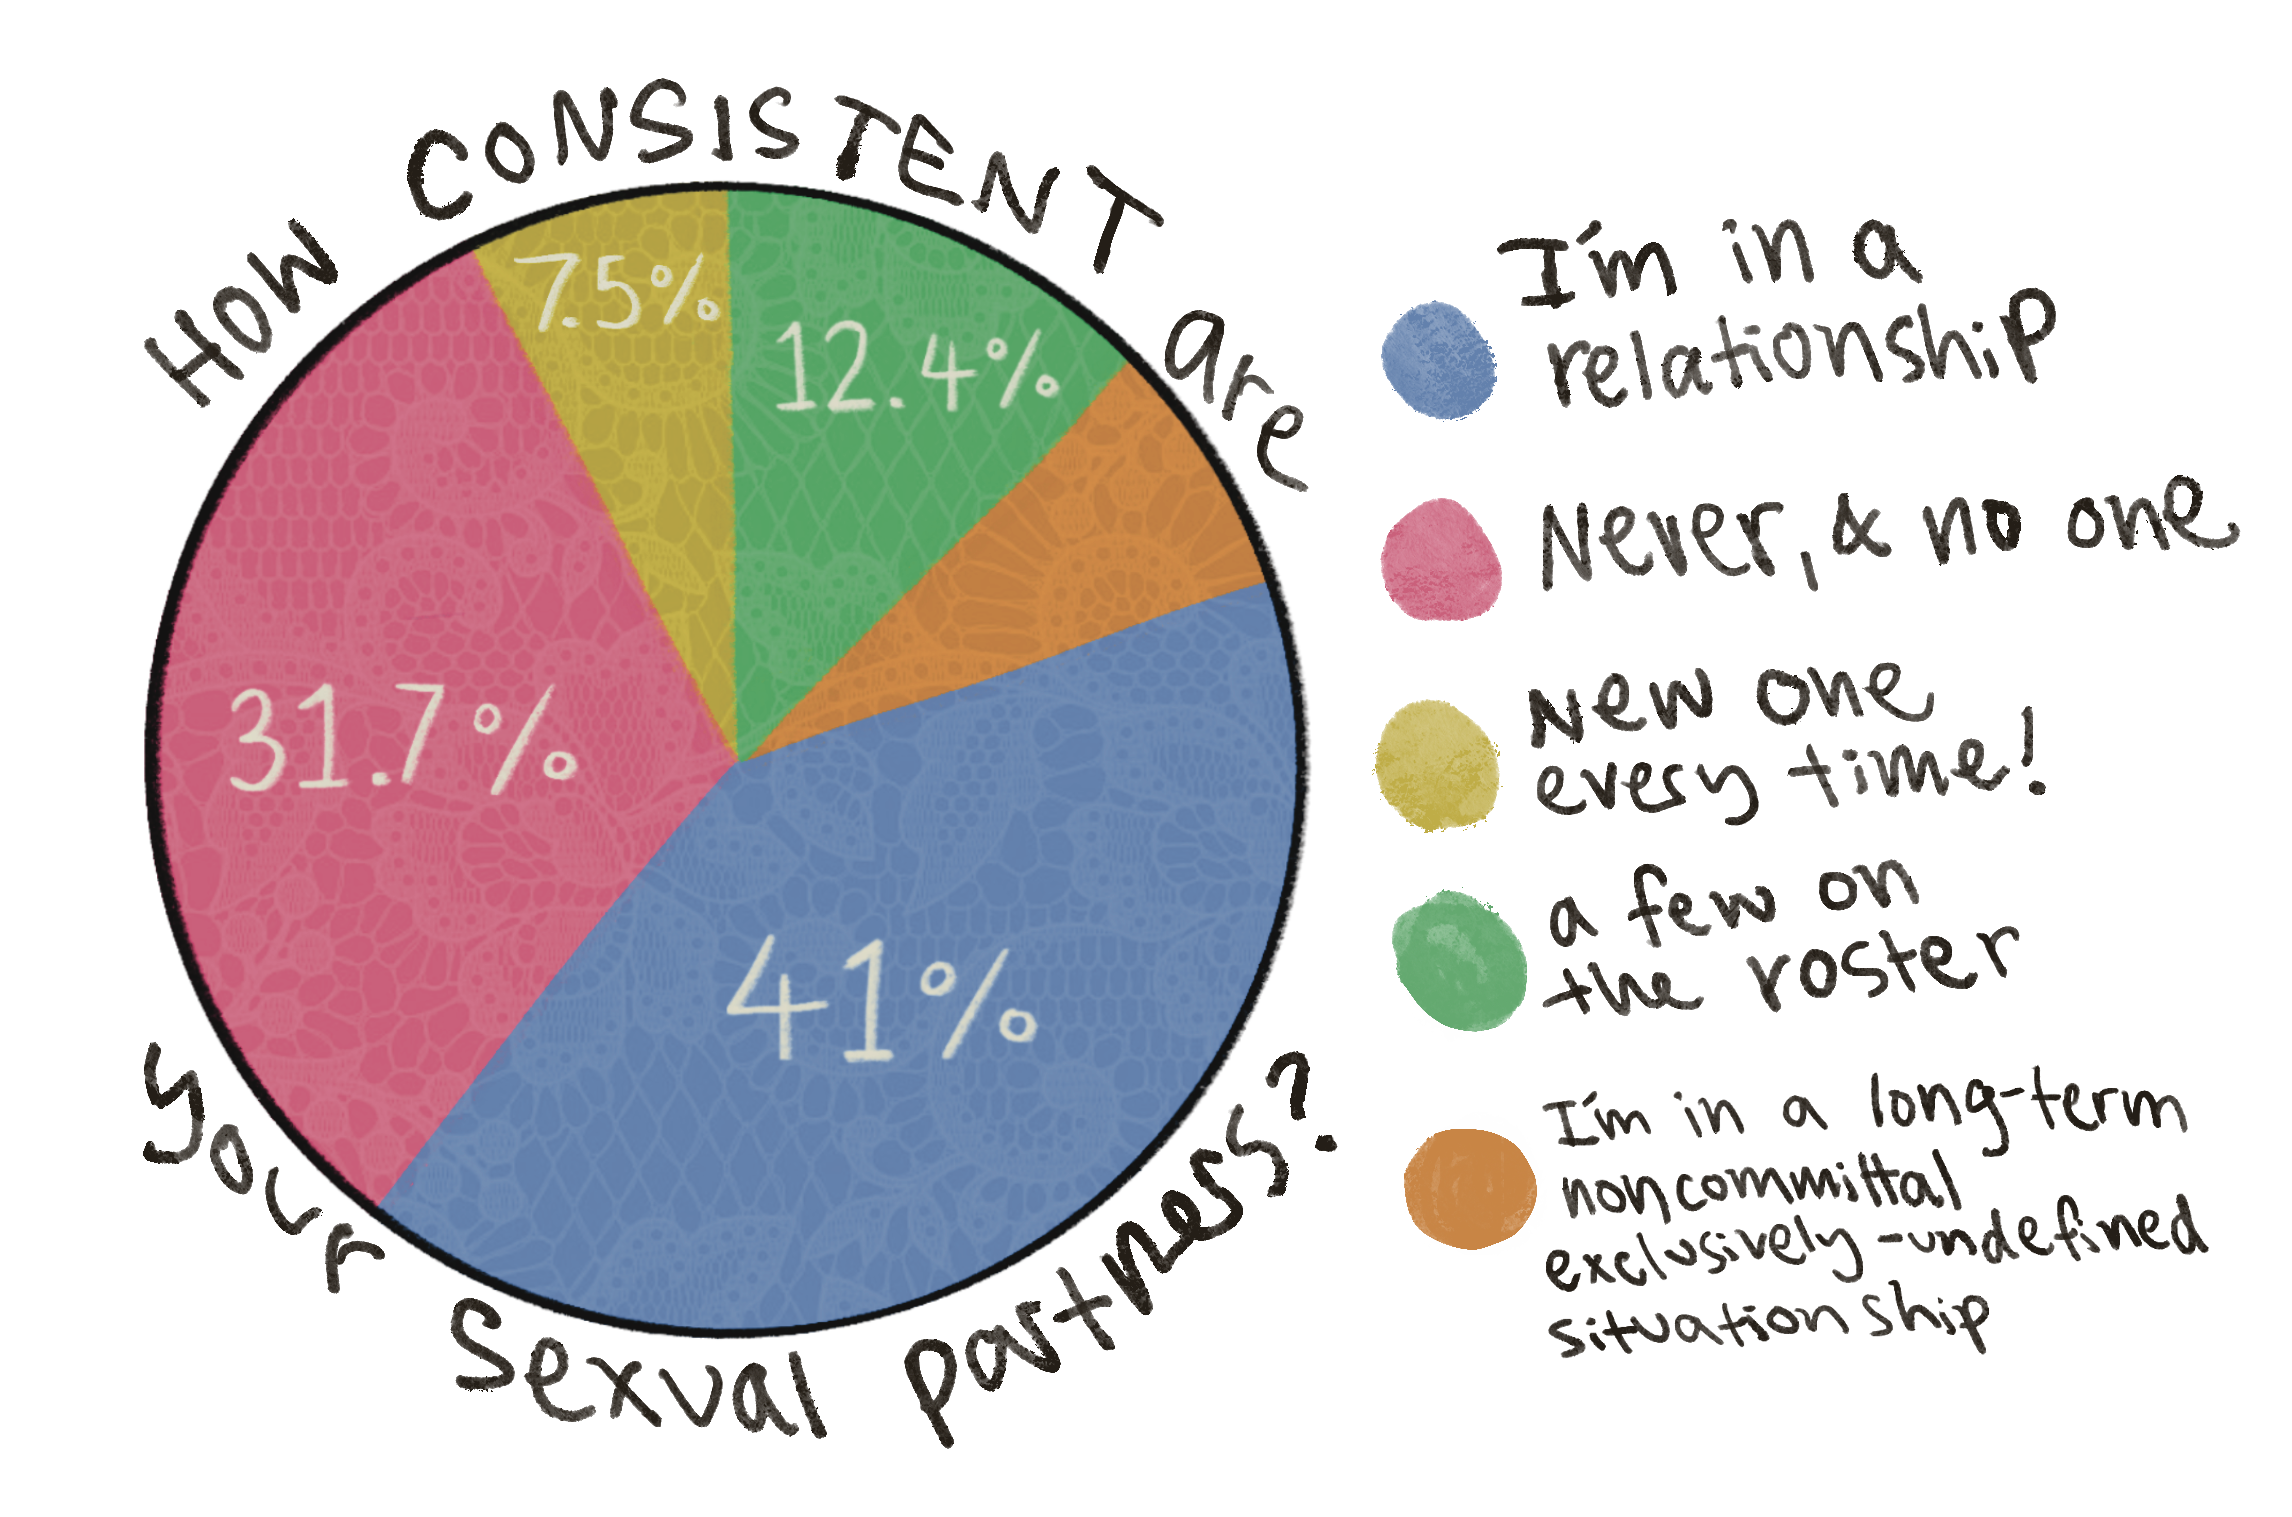
With the current state of the modern dating scene, let alone the shitshow that is the Dunedin scene in particular, it's unsurprising that 51.8% of you are single. 38.6% are in a relationship. 9.6% of you are in Hell (stuck in a situationship). Or, god forbid – “dating someone exclusively, but we aren't official”.
Despite that, 59% of you have been in love (aw). 20.5% reckon they haven’t been in love, with 13.6% being unsure, and a further 6.9% saying that it’s a sensitive topic. With half the campus single, there’s plenty of fish in the sea for you all to fall in love with. Most importantly, there are people other than your evil situationship to fall in love with.
Sex
Turns out students overestimate how much sex their peers are having. Surprise! Unless, of course, the people having all the sex just don’t have the time for the census afterwards. If so, we recommend a more balanced lifestyle. 51% of you think that you’re having less sex than your peers, and 22.9% think they’re having more. If you want some numbers to compare yourself to, rather than just vibes and ego, we’ve got you: 19.3% of you are virgins, 25.2% have slept with one person, 8.5% have slept with more than ten, and the average body count of this sample was 3.5.
When it comes to how often you have sex, 29.6% said never, 18.7% said a few times a year, 14.7% said a few times a month, 23.7% said a few times a week (8 single people put this as their answer – we’re impressed), 9.5% said once a week, and 3.8% said everyday. The majority (51.7%) of people in a relationship are having sex a few times a week, and the majority of single people (51.4%) have never had sex. To the person who replied that their vagina “whispers secrets of a time before celibacy”, we have all the faith in the world in you getting back out there.
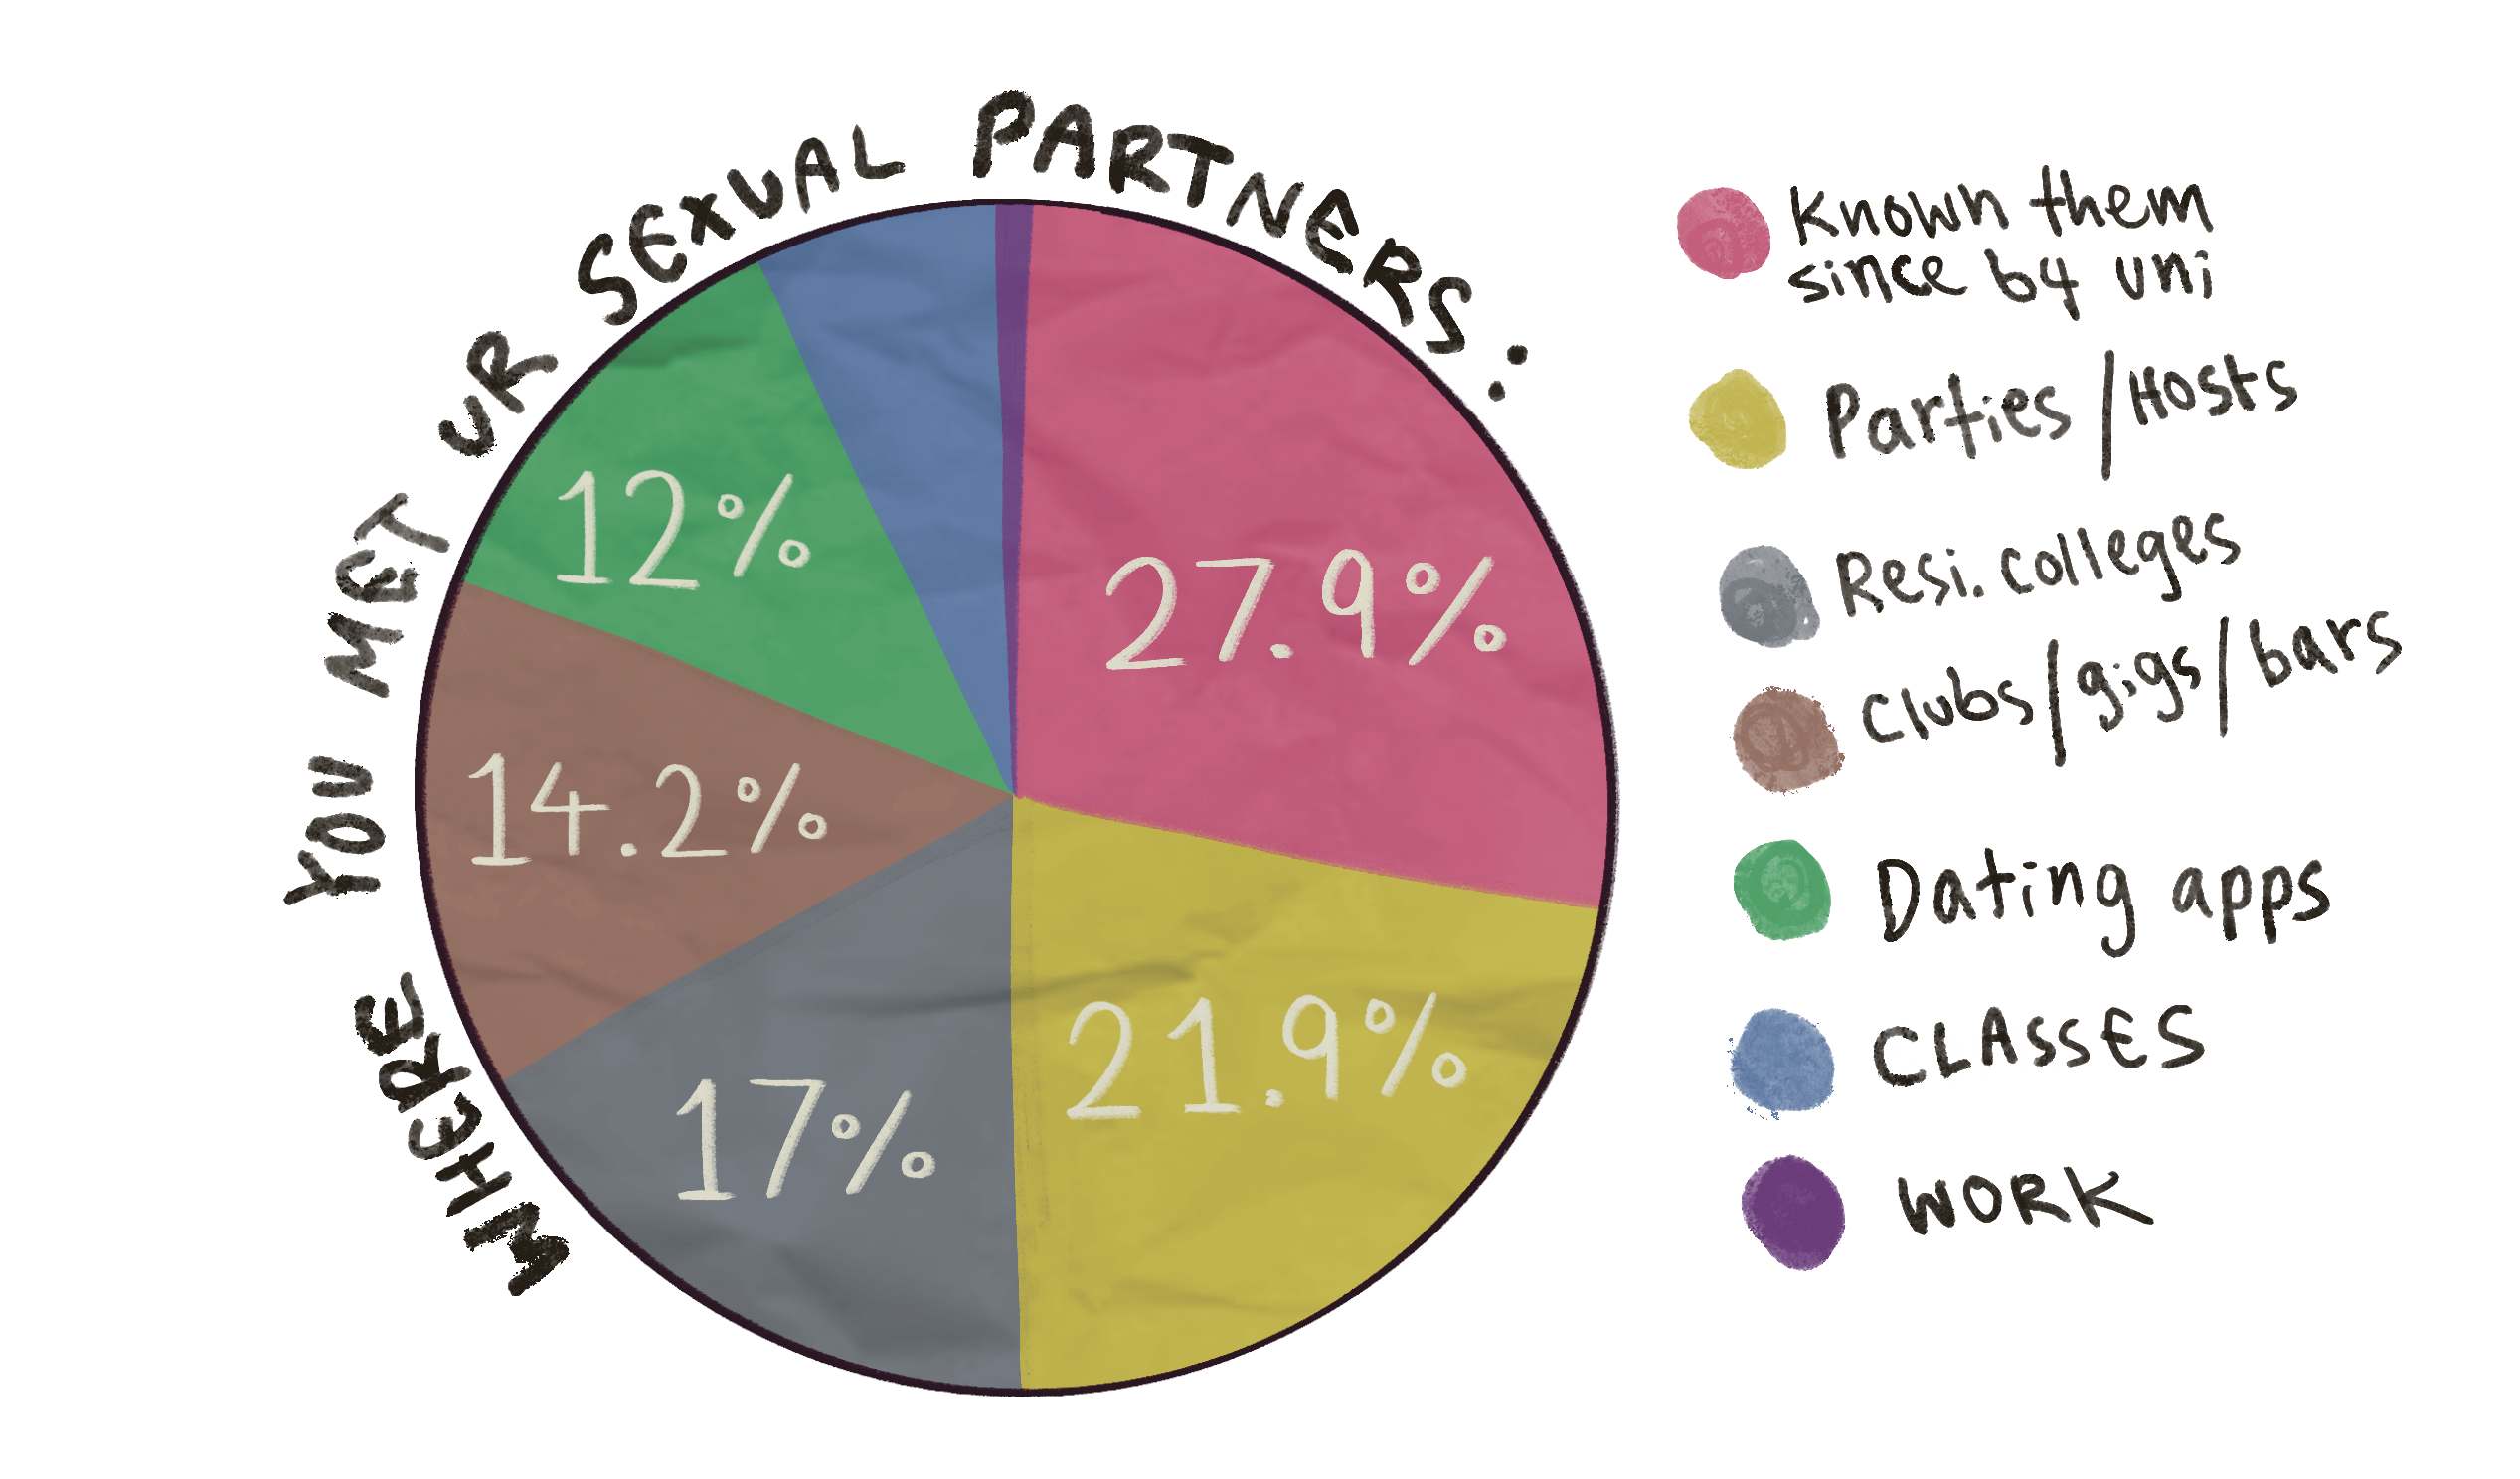
To the 27.9% who have known their sexual partner(s) since before uni – it’s okay to branch out.
61.4% of you have never been tested for an STI. Sexual Wellbeing Aotearoa is located in Burns House on George Street near the Octagon. If you’re under 22, your visit is free.
 Porn
Porn
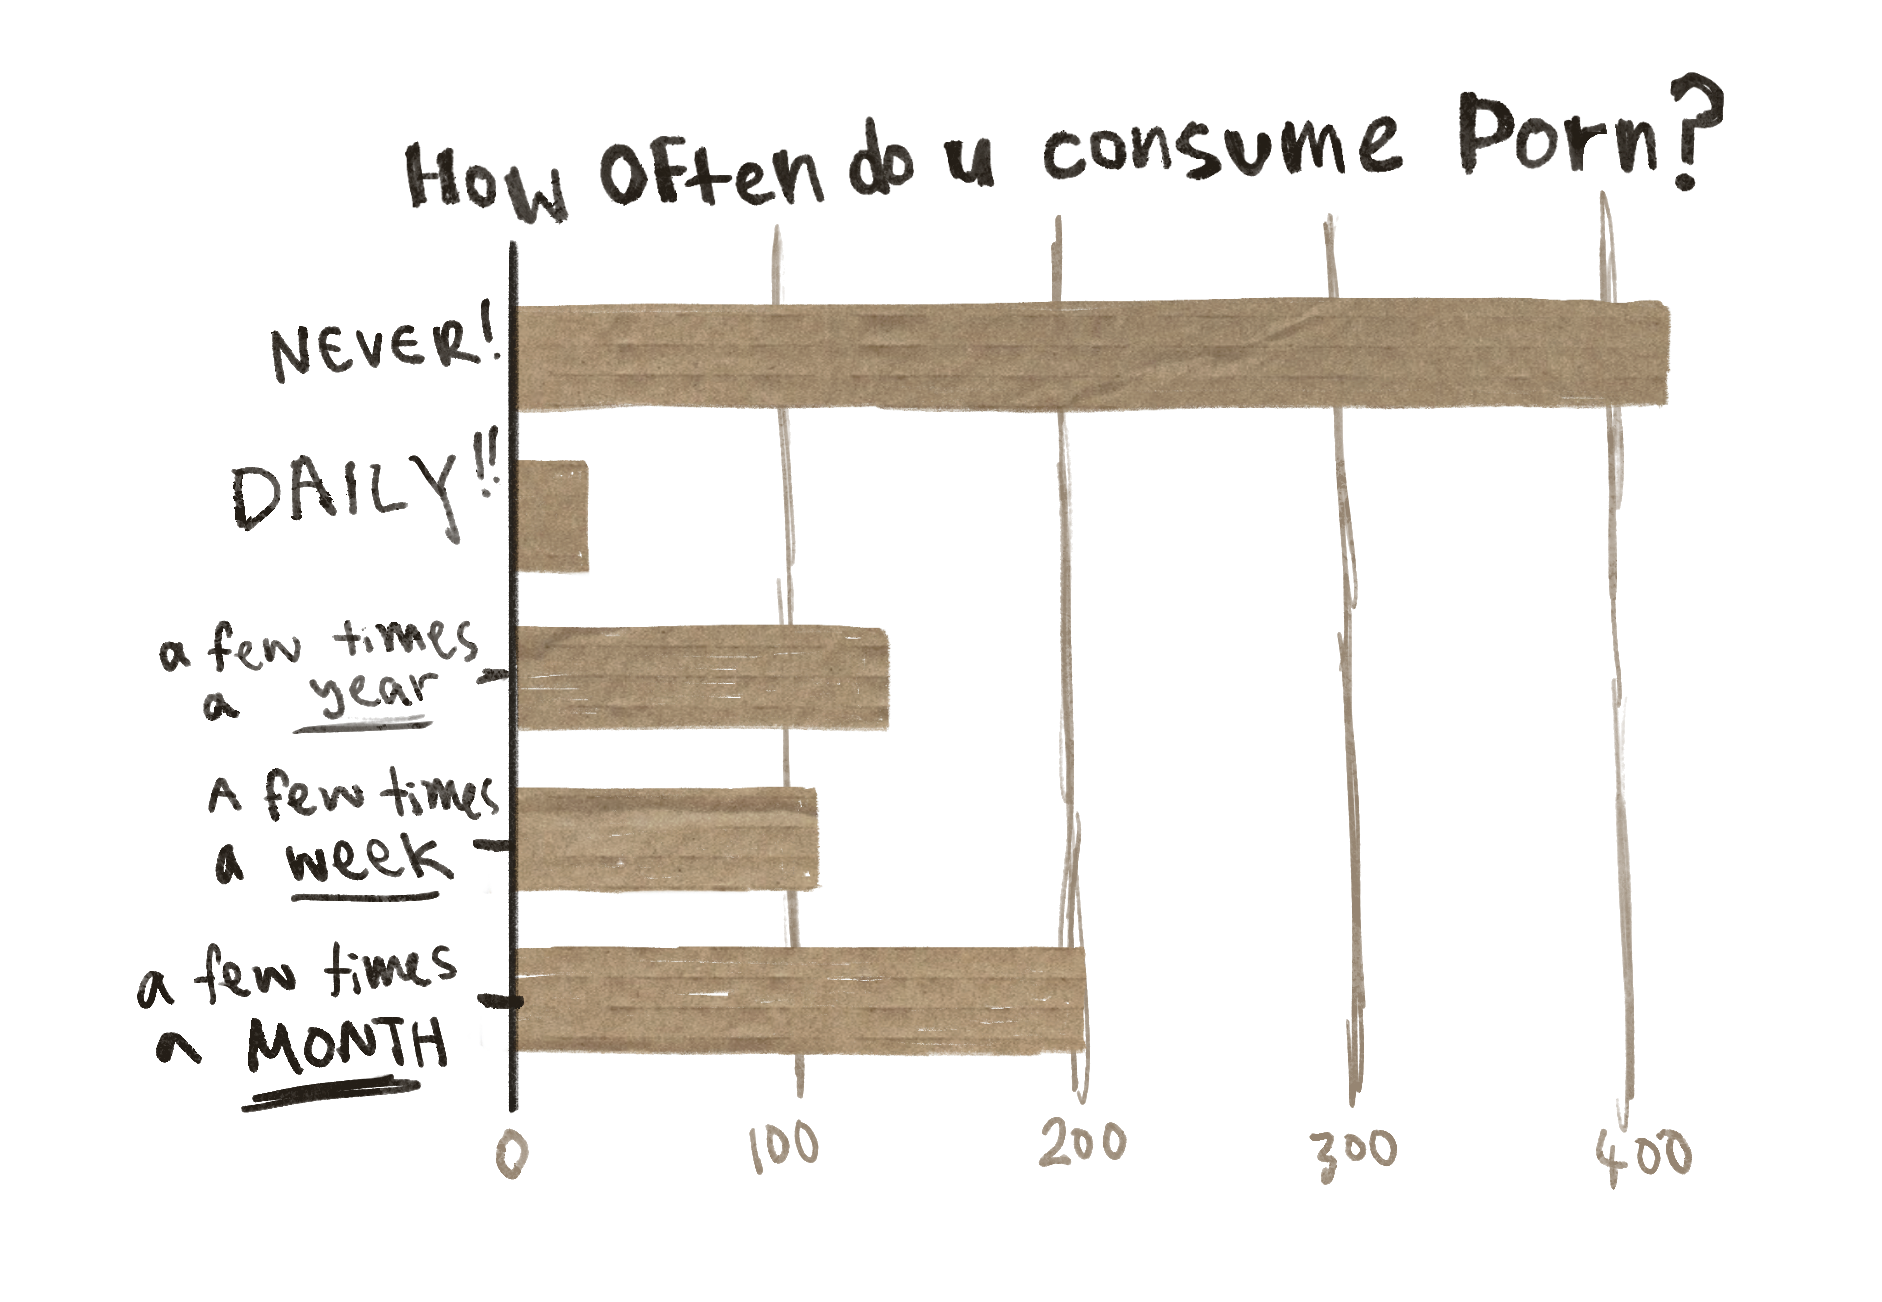
42.9% of you never consume porn, which is a decrease from 2024’s 48%. We’d say you’re getting hornier, but realistically, you’re probably just getting more honest. Not as honest as 2023, apparently, where 73.8% of respondents admitted to consuming porn in some form.
Out of those who do, Pornhub or other free porn sites is your top choice (34.6%), followed by Reddit (22.3%), and X or other social media (22.3%). Erotica comes in with a captive audience of 18%, with one comment adding that it’s “superior to porn as it doesn’t actively harm women xoxox”. Shout out to the three people who said AO3 was their most used app.
Celebrity Crush
Ah! An ice-breaker on par with “what kind of music do you listen to?” This provides a fun list for us to look through, and a brutal list to put into Excel. Jacob Elordi took out the win with 30 votes, followed by Theo James (22 votes), and our very own Craig Daniels (14 votes). To whoever put “Tamar the Great, Queen of Georgia from 1184-1213 AD”, you should get out more.
Nights Out
Speaking of going out, flat parties were clearly students' favorite way to do so, with 54.1% of the vote (and another 2.6% if you add afters). Clubbing and bars came out pretty even, at 15.4% and 15.1% respectively. Gigs and Pint Nights came in at 12.8%. 15.9% of respondents said that they have stolen a pint glass from Pint Night, and only 1.4% said they were caught. Stealthy!
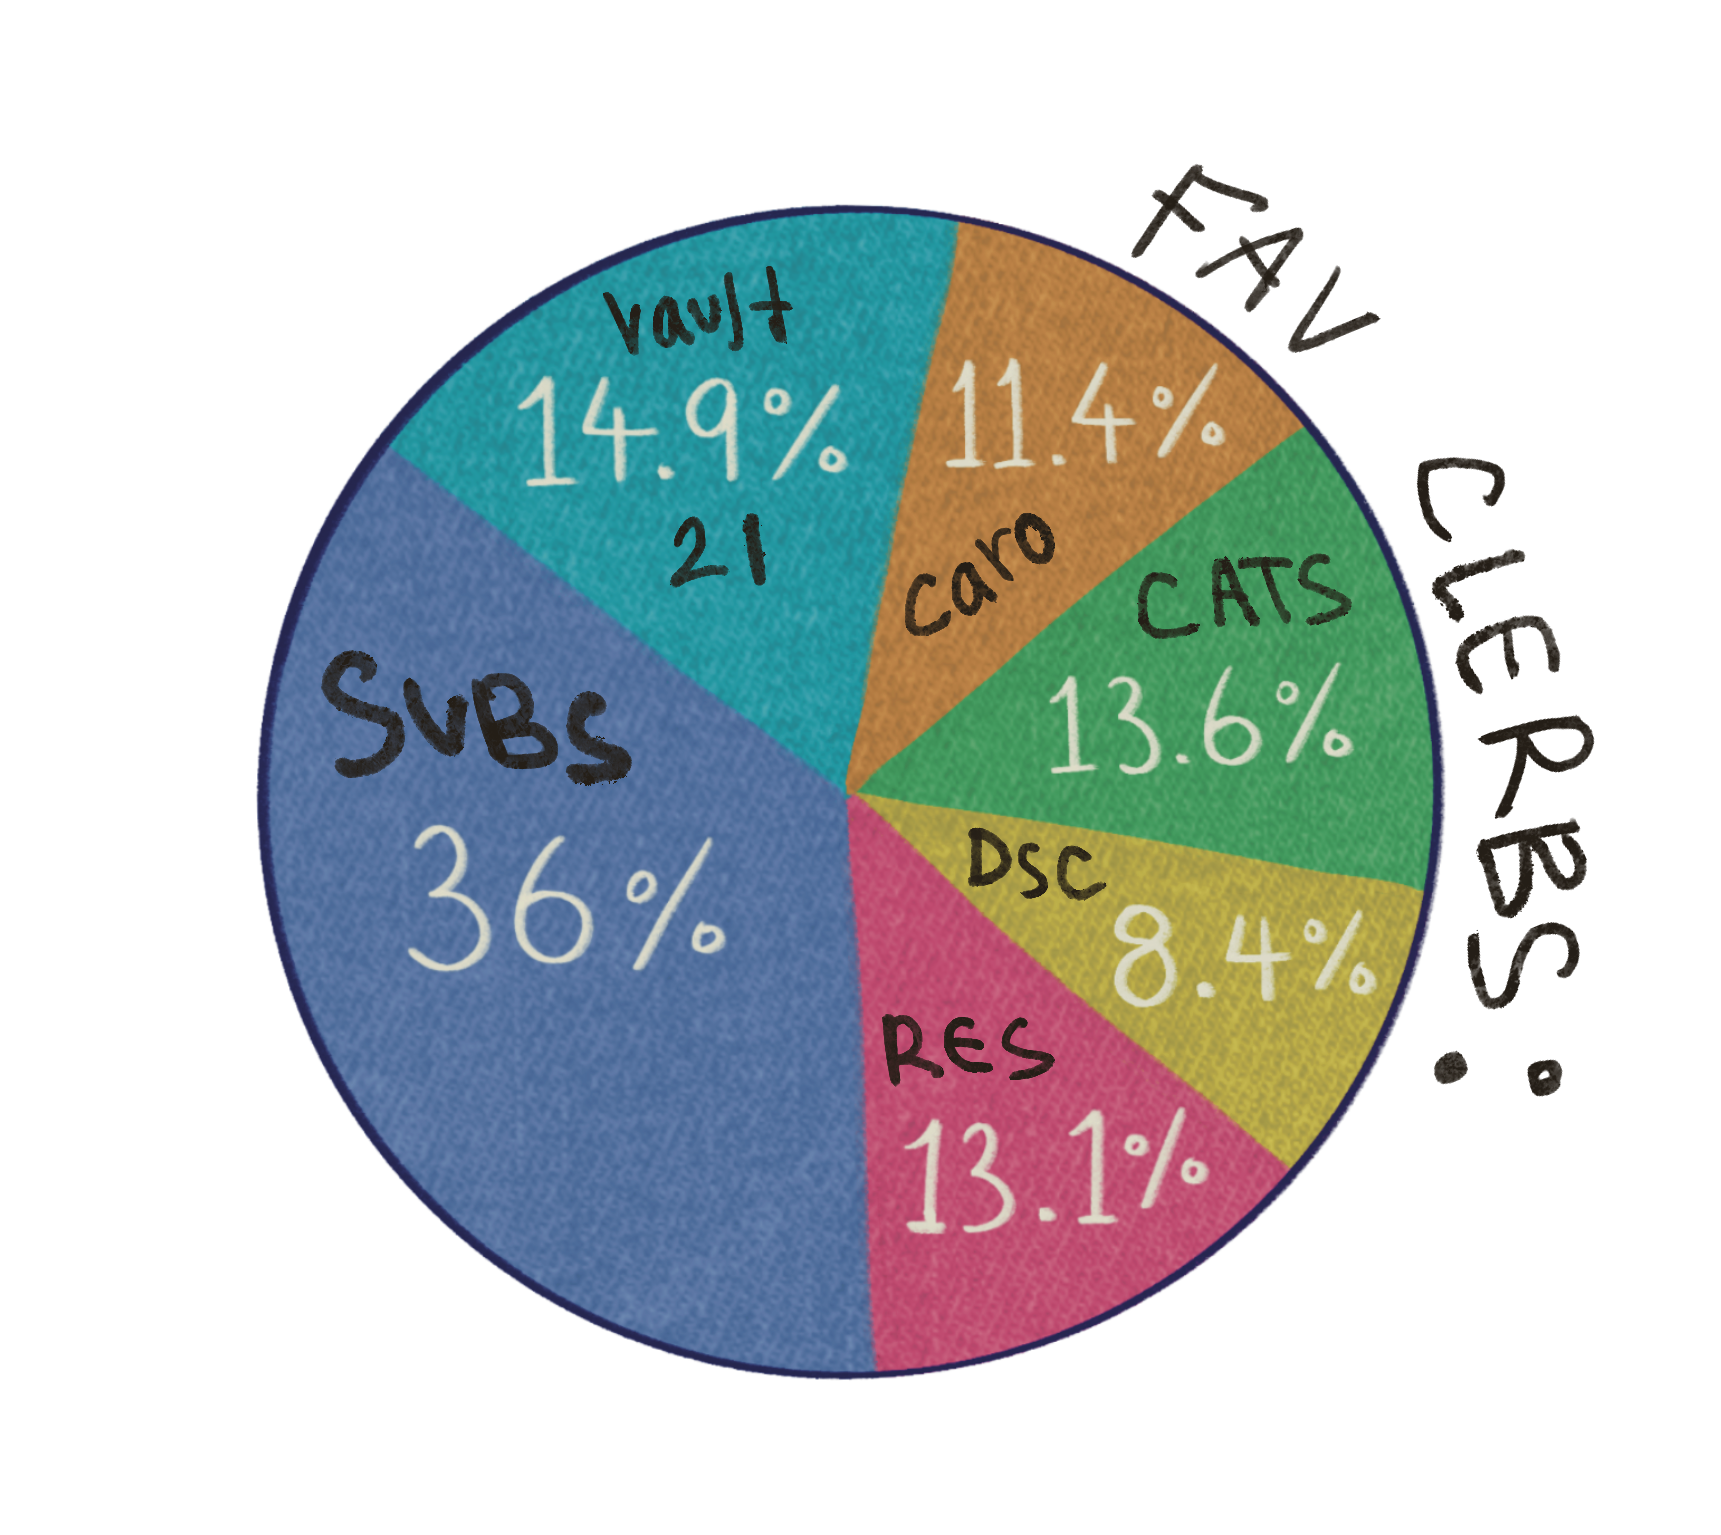
Suburbia won best club (again). Do we even need to do the correlation with Freshers?
Most people thought you should stop going to town once you hit postgrad, but a lot argued variations of “town should never end” and you should “follow your heart”. There was a general consensus that you should steer clear of Suburbia and Catacombs once you hit third year.
Saturday was unsurprisingly the favourite day to go out, but respect to the one person who said Tuesday. Can we come wherever you’re going? Unless it’s the Baa quiz night (Bog supremacy).
52.8% of you believe Castle is dead, 17.8% think it’s still alive and kicking, and 11.1% (rightfully) told us to fuck off. A lot of people referenced the exclusiveness of it as the reason it’s died out, a few blamed DnB, the lack of couch burnings, or the removal of Castle26, and a lot blamed JAFAs. A few took a second opportunity to tell us to fuck off (less rightfully, we gave you your chance).
When asked if they’ve done a red card in the last year, 26.1% asked what a red card was. What’s happened to our student culture? 45.5% haven’t been to one, and 12.5% have only attended a single one. Genuinely gutting.
Drinking
It’s time to further debunk Otago’s reputation for alcohol abuse. It turns out that 14.1% of students don’t drink, and most people (73.9%) only drink 1-2 times a week.
Health NZ recommends that women shouldn’t drink more than 4 standards at a time, and men no more than 5. 22.7% of you are below this (including non-drinkers, and those who have 1 to 4 standards on an average night out). 38.2% of students will have 5 to 8 standards on a night out, and we bet they don’t tell Student Health that. The 20 of you that reported having 18 or more standards on a night out, we really hope you tell Student Health that.
Despite those statistics, 51.1% still believe they drink less than their peers (compared to 42.7% in 2025). 36.3% think they drink the same amount, and 12.6% think they drink more (10% in 2025).
Drugs
Marijuana takes the Student’s Drug Of Choice Award! Keeping its title for another year running, 66.6% of respondents (649) have used it recreationally (a little lower than 72% in 2025). Of these people, 442 use joints, 332 use a bong, and 323 take edibles. There’s a lot of overlap there – you guys like to change it up. MDMA also kept its second place position, increasing to 41.3% having used the drug from 39.9% in 2025. Ketamine took Ritalin’s third place spot with 23%, and Ritalin (unprescribed) came in with just 21.8%. Cocaine truly is on the rise, with 13.1% of respondents reporting use. 27% of you haven’t taken any drugs recreationally. Squares.
60.1% of people who have taken drugs have never tested them. Boo! Know Your Stuff offers free and discreet drug testing. 8.7% test them every time. Yay!
62.4% of people said they don’t vape, even socially (22.7%). However, only 57.1% of respondents said they don’t smoke cigarettes. 34.5% said they smoked cigarettes socially, and 8.5% said they smoked in general, compared to 14.9% who say they vape more than just socially. 62% of you said drunk cigarettes don’t count.
Mental Health
Only 16.6% of students reported not struggling with their mental health, pretty similar to 2024 in terms of figure (15%), and concern. This leaves 83.4% who did report struggling, or struggling sometimes, but only 24.9% of students have been diagnosed with one or more mental health issues, a decrease from 2024 (27%). However, 66.5% of respondents have sought support from Student Health’s Mental Health and Wellbeing Services, more than double the 2024 figure of 32.1%. A huge win for student support, and knowing when to ask for help. Kia kaha!
Finances and Flatting
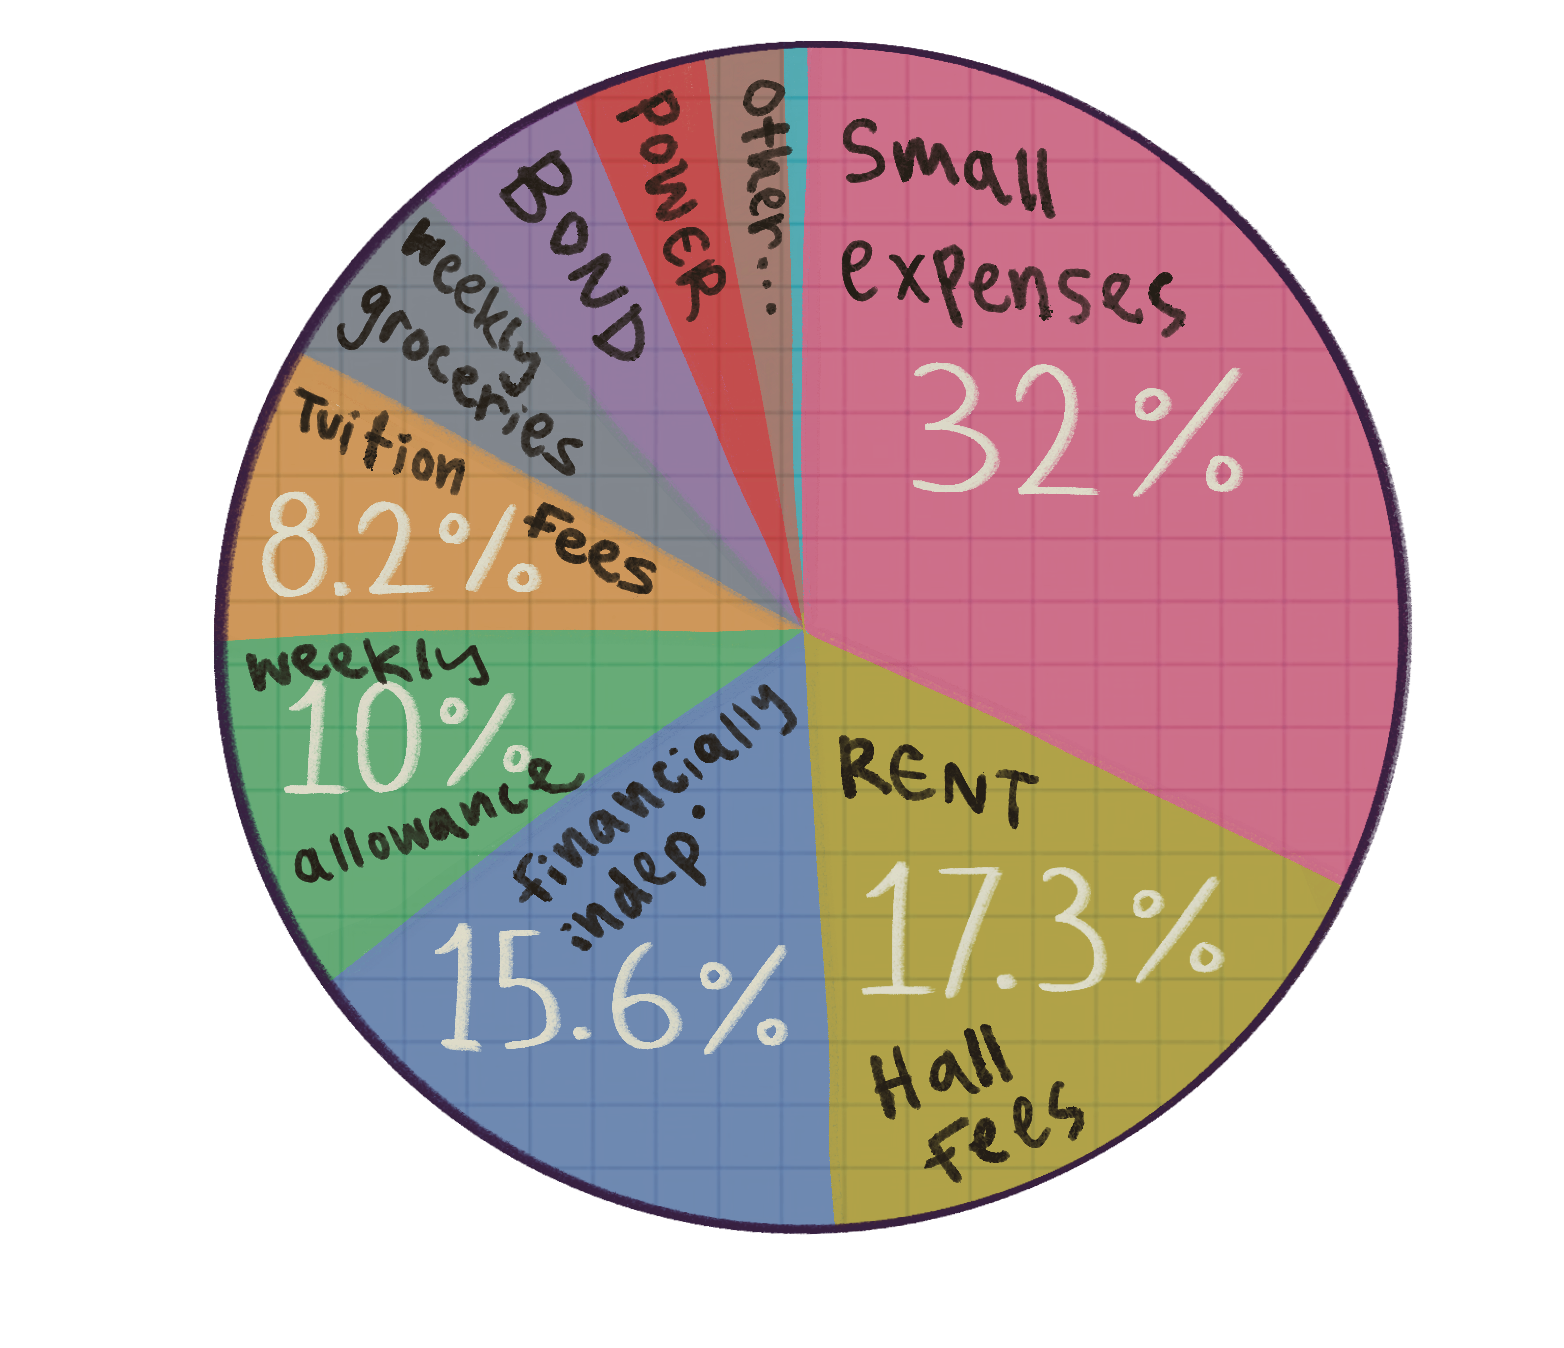
Even as the cost of living crisis seems to only get worse, 77.7% of students aren’t eligible for student allowance – the most consistent figure in our results since 2022. This leaves a lot of students relying on parental support (except for the 15.6% of you who are financially independent). 32% of students said their parents will pay for some small expenses, or that they can ask them for money occasionally. 17.3% said they contribute towards, or pay rent, and 8.2% said the same for tuition. 10% get a weekly allowance, and 5.5% get weekly groceries. There are also a few who receive money for their bond, power bills, or other small contributions.
Other than parental support, students are finding other ways to make ends meet, with 17% working casual shifts, 37.5% working part-time, and 1.8% working full-time. Hats off to those soldiers. That leaves 43.7% of students unemployed (although 13.4% of these are actively searching for j*bs).
Average rent has officially hit $200 a week, an increase from $190 in both 2025 and 2024. Before that, we clearly weren’t being nosy enough. This year we asked students to round their weekly rent to the nearest $25, and of those who answered this question, 43.5% landed at $200, 21.8% at $175, and 18.2% at 225. 6 of you rounded to $100, and 9 to $300.
With rent increases and the cozzie lives crisis, flat relations may be strained. Luckily, 66.4% of respondents haven’t let mounting pressure cause excessive flat beef, as they still like their flatmates, which is lovely to hear. The minority of respondents only like some of their flatmates (20.3%), only sometimes like their flatmates (10.2%) and some straight up don’t like their flatmates (3.2%). Thoughts and prayers – you’re making us regret not asking a question on flat beef.
While we’re on the topic of flatting, 81.1% of students have not had scabies. 10.1% have (we’re sorry), and 8.8% have treated just in case. Scary!
OUSA
Vice-Chancellor Grant Robertson received an average rating of 3.65 stars, pretty much exactly what he got in 2025 (3.66 stars).
Of the students who said they were enrolled last year, 51.9% voted in the OUSA election. The average understanding of what OUSA does was ranked at a 3.1 out of 5. OUSA President Daniel Leamy thinks this isn’t a bad result. For the 66 of you who didn’t understand at all what OUSA does, Daniel says it’s “a wide range of things from advocacy, to clubs, student support, events and student media.” For sure.
56.8% know who the OUSA president is. President Daniel Leamy said he’ll “take that”, adding that “the vast majority of advocacy happens behind closed doors” so students often don’t see the work being done on their behalf.
Politics
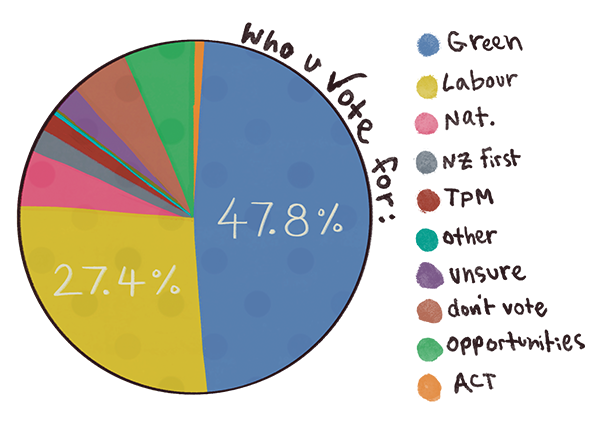
82.9% of you don’t like the current National-Act-NZ First Coalition government, and 13.1% of you are unsure of your feelings towards them. If the election was today, 47.8% would vote Green, demolishing the two party system and leaving Labour with 27.4% and National with 5.4%. To the 5.4% of you that don’t vote, please reconsider this year.
Waterbottle
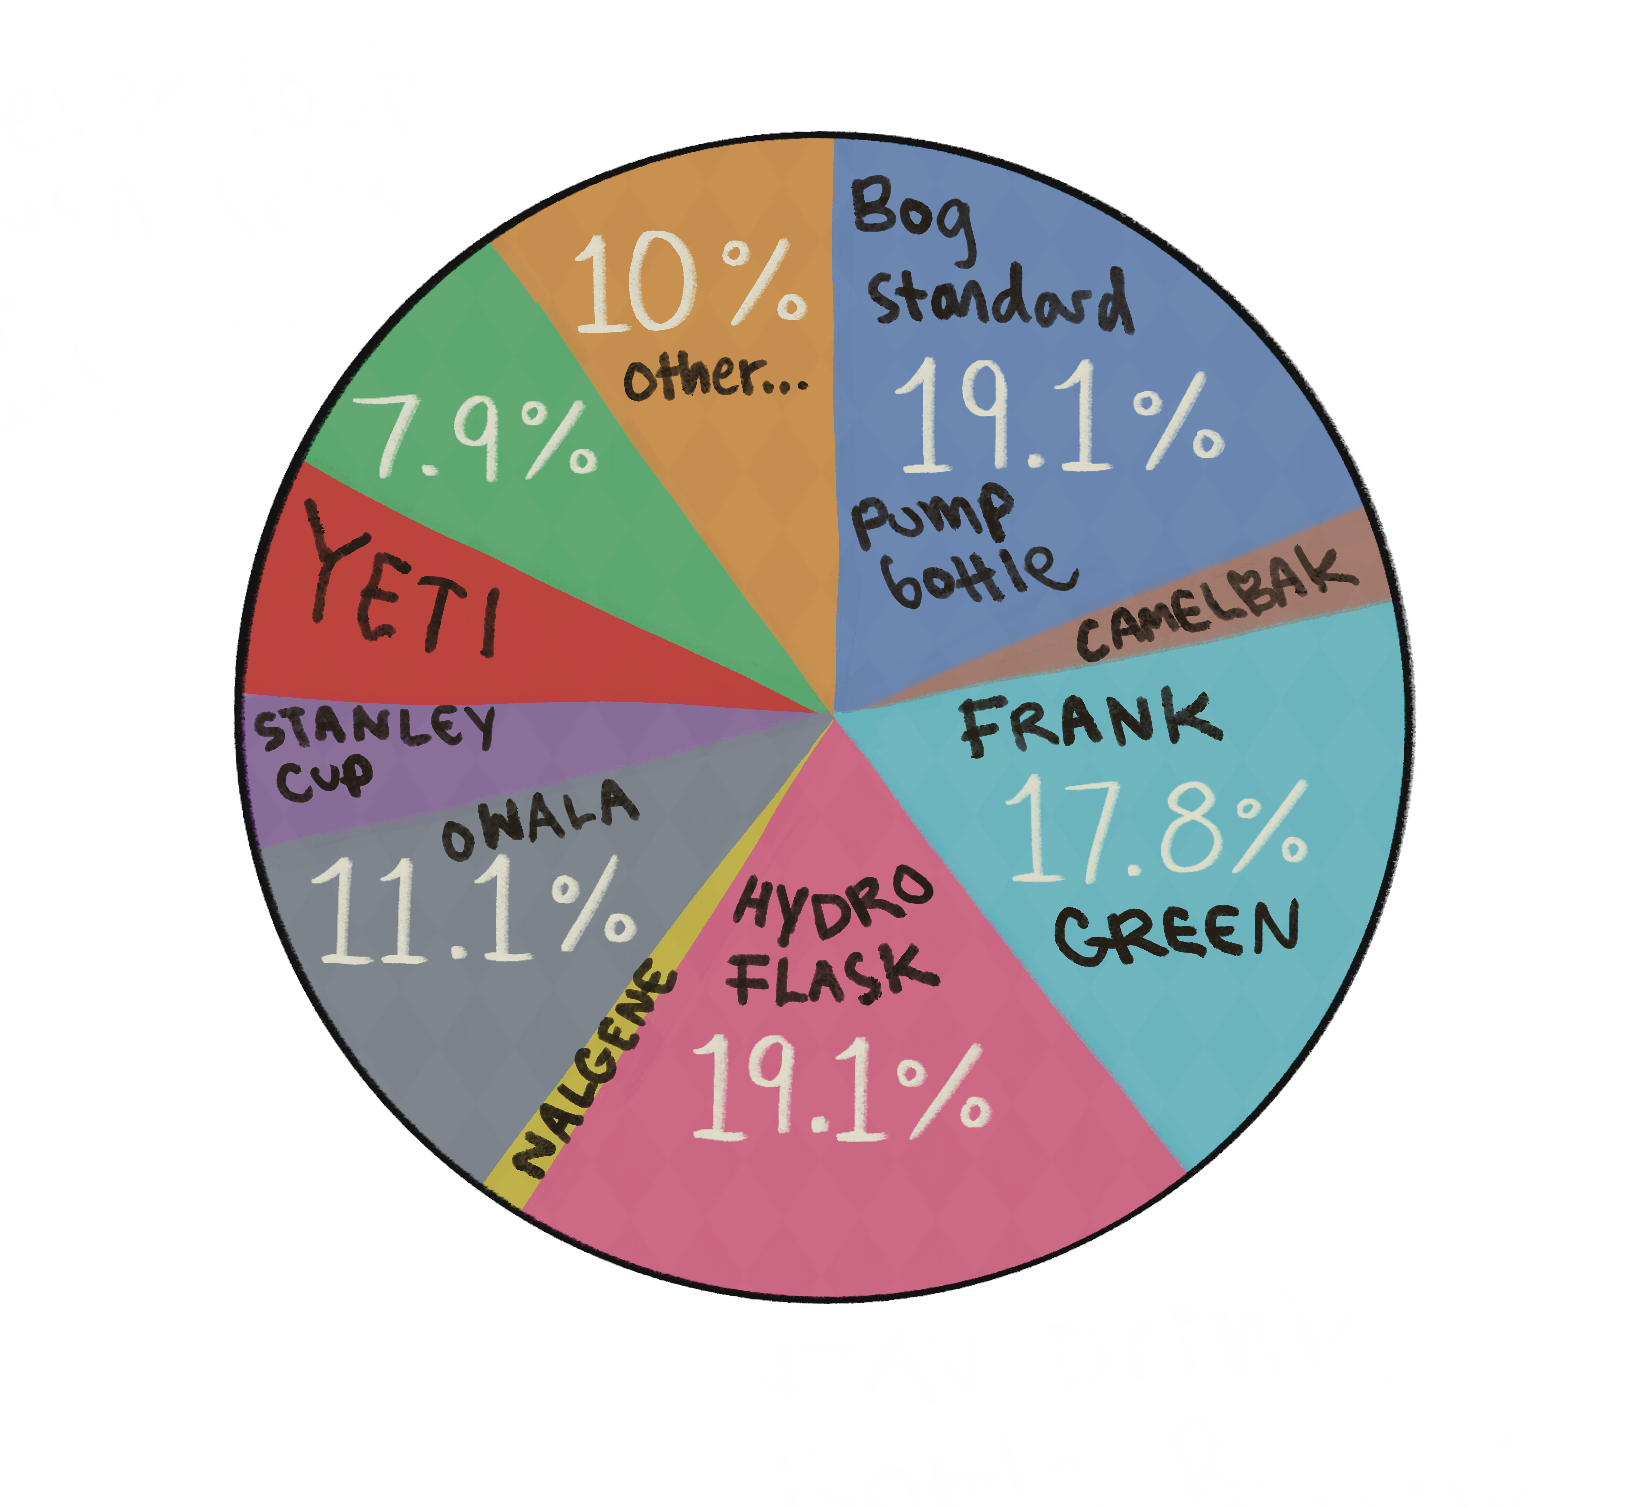
And finally, there was a tie for favourite drinkbottle between bog standard pump bottle, and Hydroflask. Money really can’t buy favoritism.
Thank you again to everyone who filled out this year’s census. See you next year! If you have any questions, or you want to know more about any stats in particular, or you want to discuss buying this data, please don’t hesitate to reach out. We can probably help you out.
